

Building a Cohort
This article steps users through the process of creating a cohort in Cohort Builder.
In this example the dataset has two dictionaries:
- Participant Profile
- Comorbidities
These will be used to demonstrate the following steps:
- Using the visualisation tool
- Building a single clause query
- Building a multi clause query
- Adding a dictionary to a cohort
- Querying across dictionaries
- Duplicating and comparing cohorts
Using the visualisation tool
Upon opening the cohort screen the user can immediately use the visualisation tool to preview the data held in the dataset.
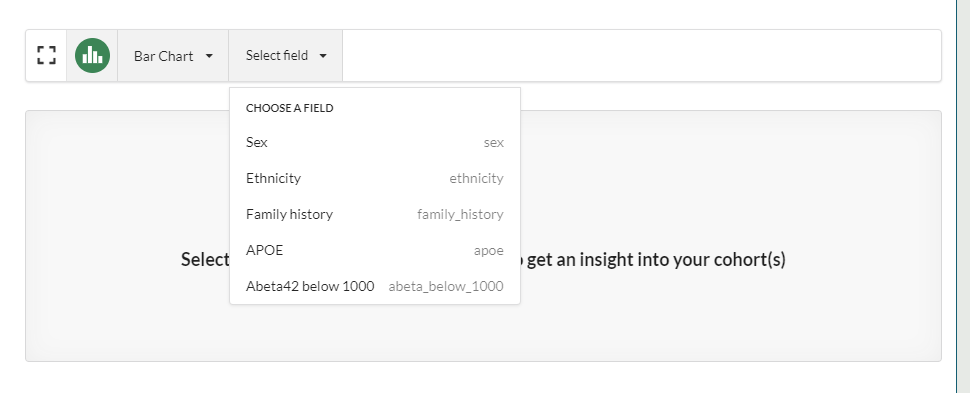
In this example, the user wants to know how many participants in the study have a family history of dementia. To do this they select Bar Chart from the chart's Select a Visualisation drop down and then Family History from the Choose a Field drop down:
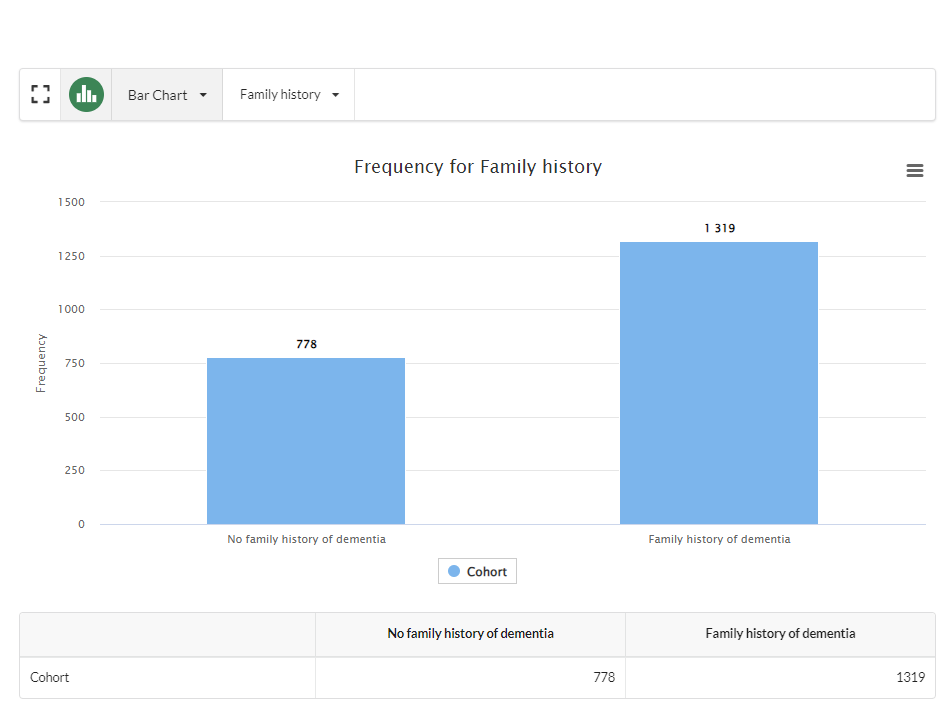
This creates the following chart:
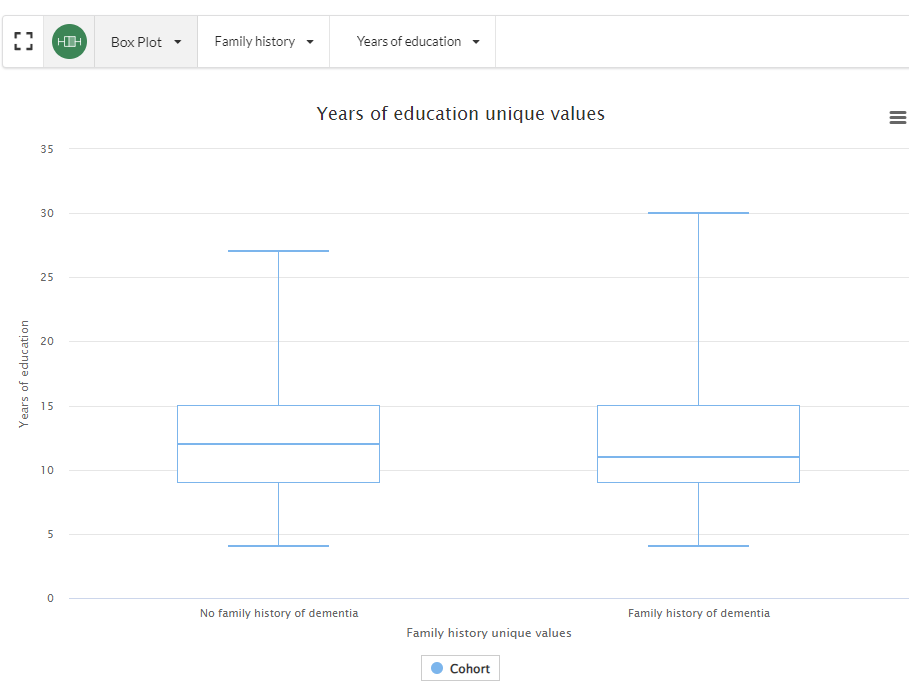
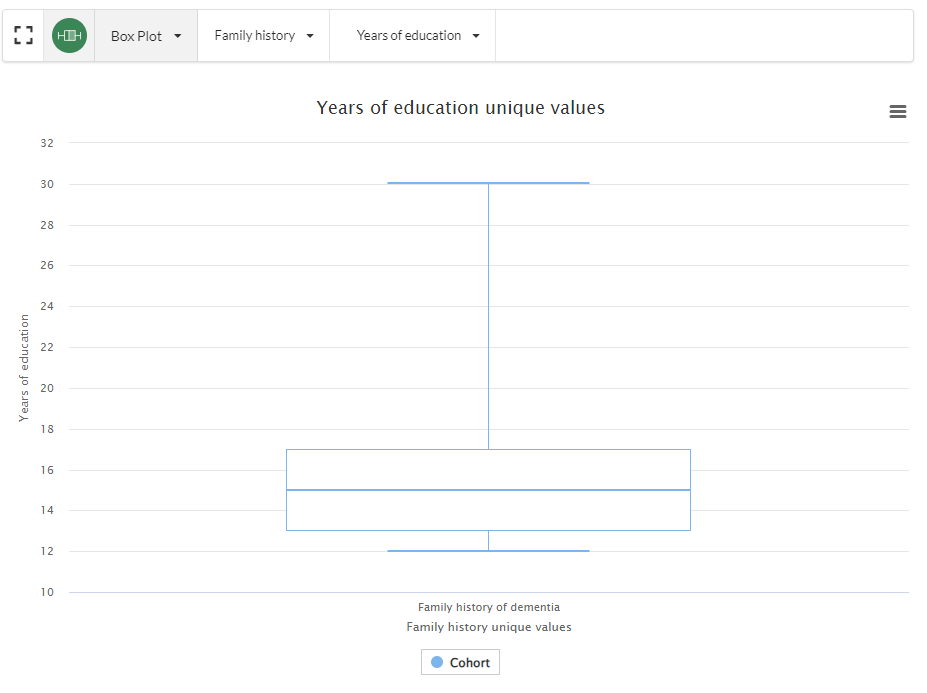
The user can toggle between the different charts before building a query. For example, a box plot comparing the the number of years in education vs family history of dementia:
Building a Single Clause Query
Now that the user has some understanding of the data, they want to start building their query, which will allow them remove participants from the cohort who do not meet their criteria.
In this example the user wants participants who have both:
- a family history of dementia
- 12 or more years of education
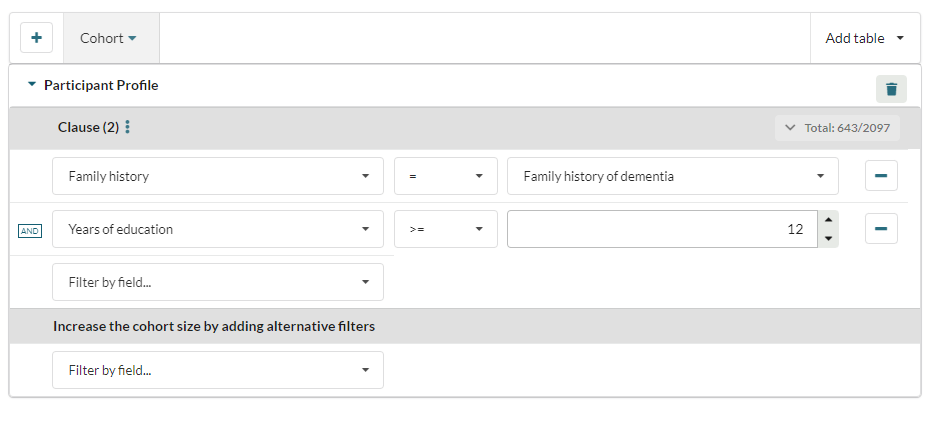
Above you can see the following:
- The user has created a single clause query which requires subjects to have a family history of dementia AND 12 or more years of education
- This has reduced the number of participants to 643 from a possible 2097
Applying this filter has also updated the visualisation to reflect the updated query:
Building a multi-clause query
In the example above the user created a cohort where the subjects have both a family history of dementia and 12 or more years of education.
If they want a cohort which contained all participants who had a family history of dementia OR 12 or more years of education then a multi-clause query is required:
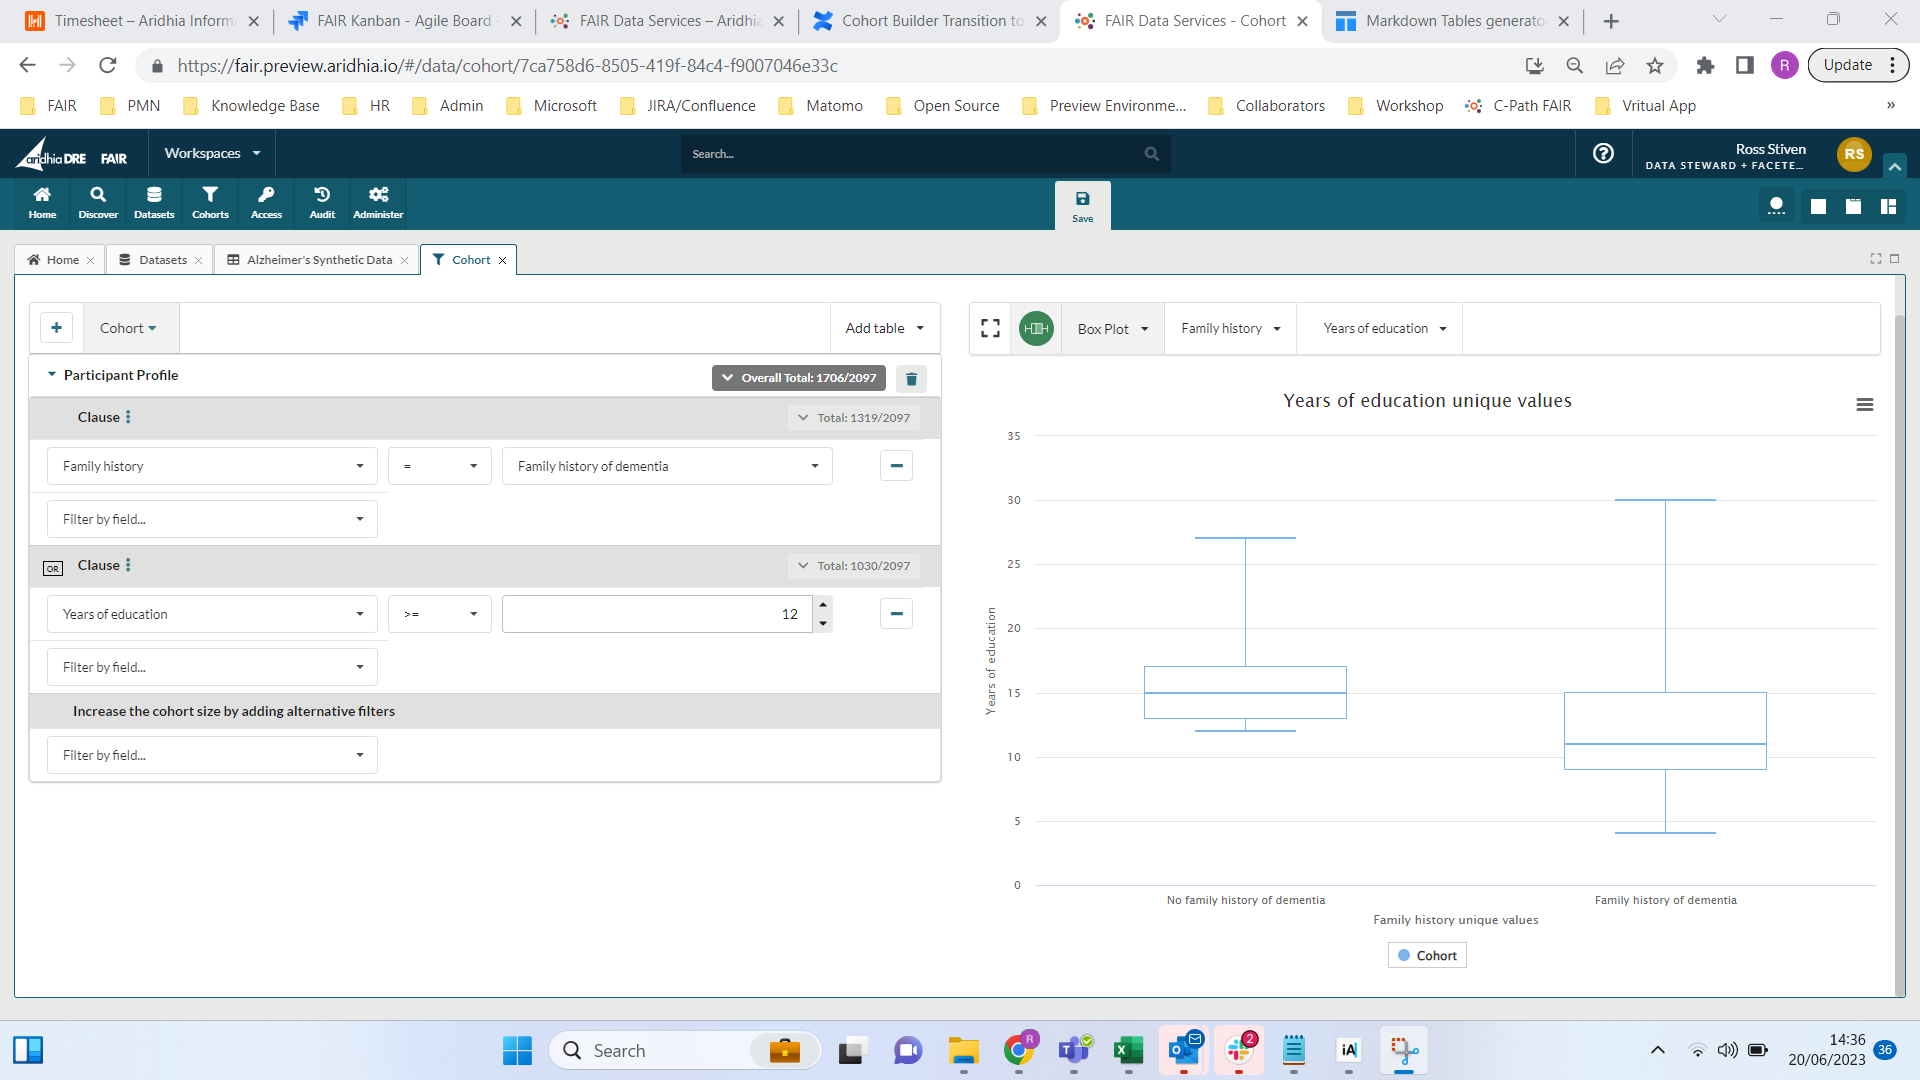
Above you can the see the following:
- The user has created a multi-clause query that contains users who have either a family history of dementia OR 12 or more years of education
- There are now three counts, one for each clause and a top level cohort count of 1706 which includes the total number of participants who meet at least one of the criteria. Participants who meet both criteria are only counted once in the top level count.
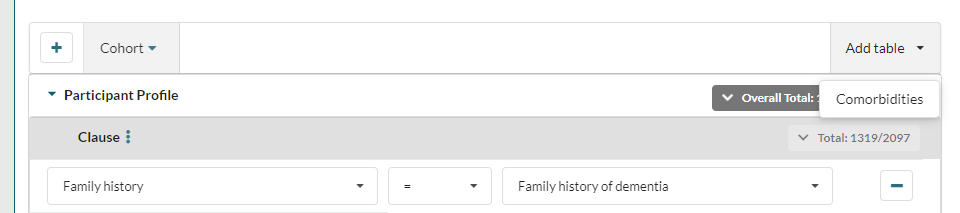
Adding another dictionary to a cohort
The examples above are queries on a single dictionary, "Participant Profile". If the user wants to explore the "Comorbidities" dictionary they need to add it to the query.
To do this they need to choose the dictionary from the Add table drop down on the top right of the query builder.
This adds the "Comorbidities" dictionary to the query builder:
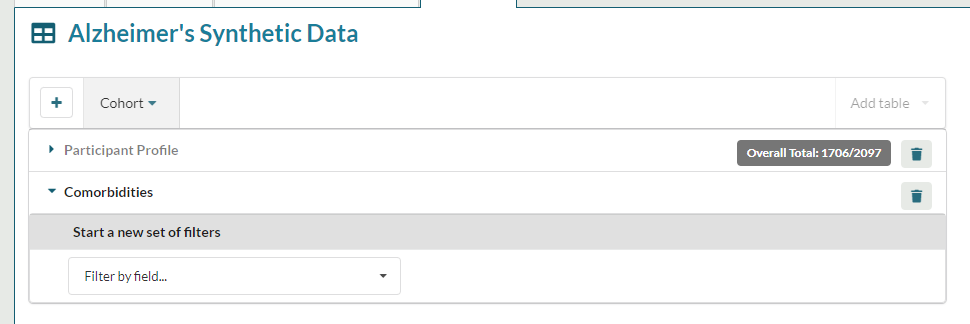
The user can now use the visualisation tool to explore the "Comorbidities" dictionaries.
Querying Across Dictionaries
By following the steps above the user is able to profile the data in both dictionaries independently. However, Cohort Builder also allows users to query across dictionaries.
The query builder has two filters which allow the user to compare data in different dictionaries:
- Includes
- Excludes
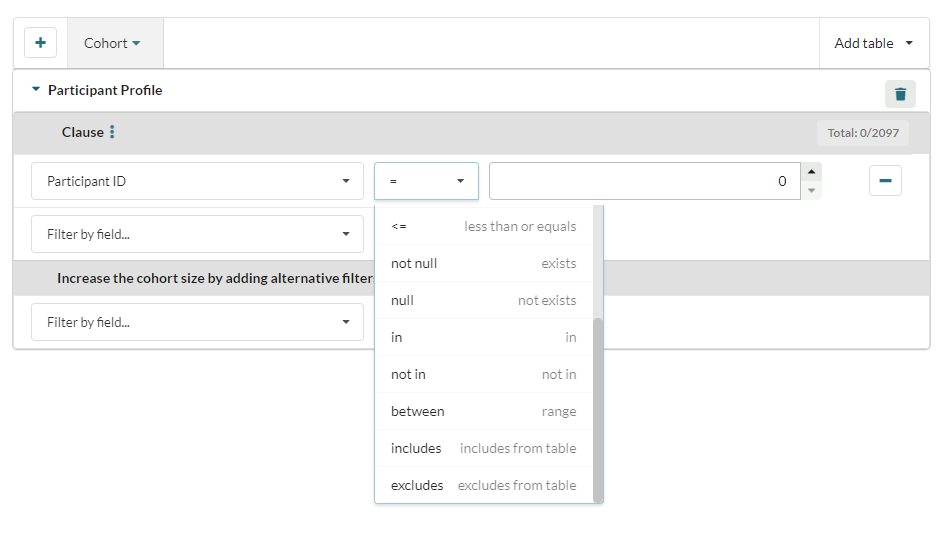
In the example below the user is comparing the values in the participant ID columns of the "Participant Profile" and "Comorbidities" dictionaries, and choosing to include any IDs in their cohort that appear in both dictionaries:
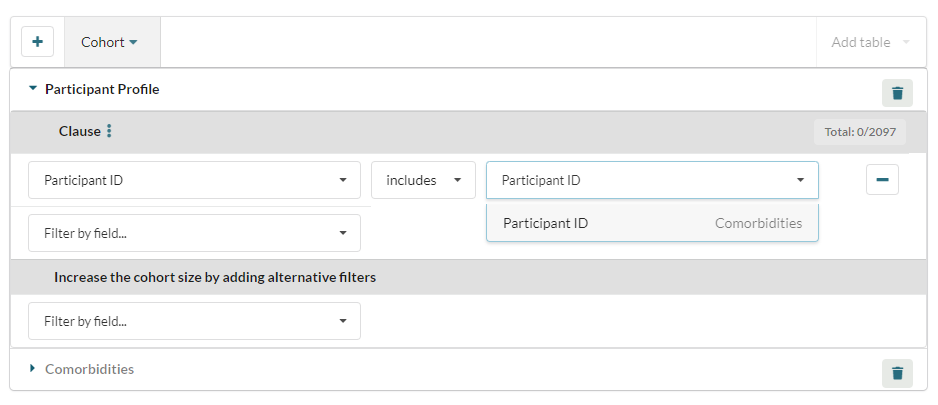
Exclude performs the opposite function, excluding any matching IDs from the cohort.
The user can employ the Include and Exclude filters to query any fields which contain the same data type e.g. text fields can be compared with text fields, integer fields with integer fields.
Duplicating and Comparing Cohorts
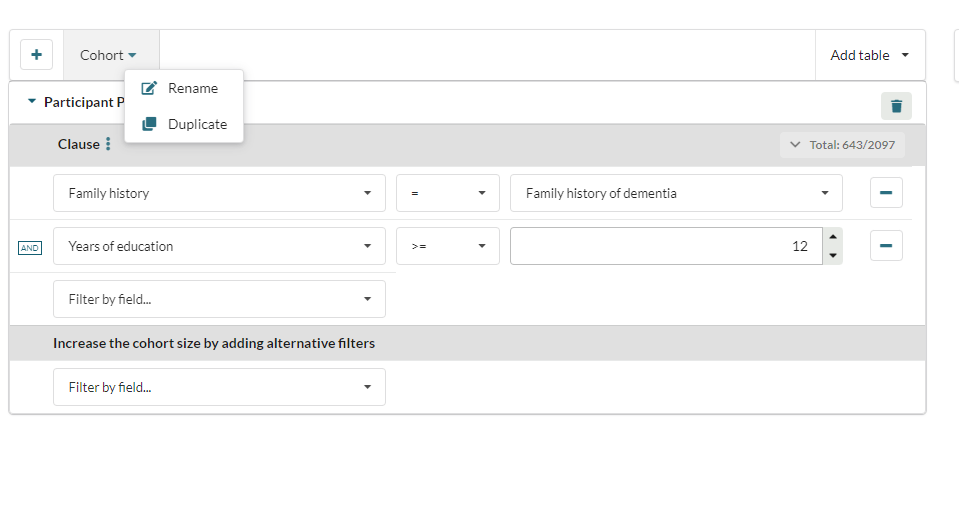
The user can also easily duplicate their cohort by selecting Duplicate from the Cohort drop down
This will create a duplicate of the existing cohort, and the visualisation will update to display both cohorts:
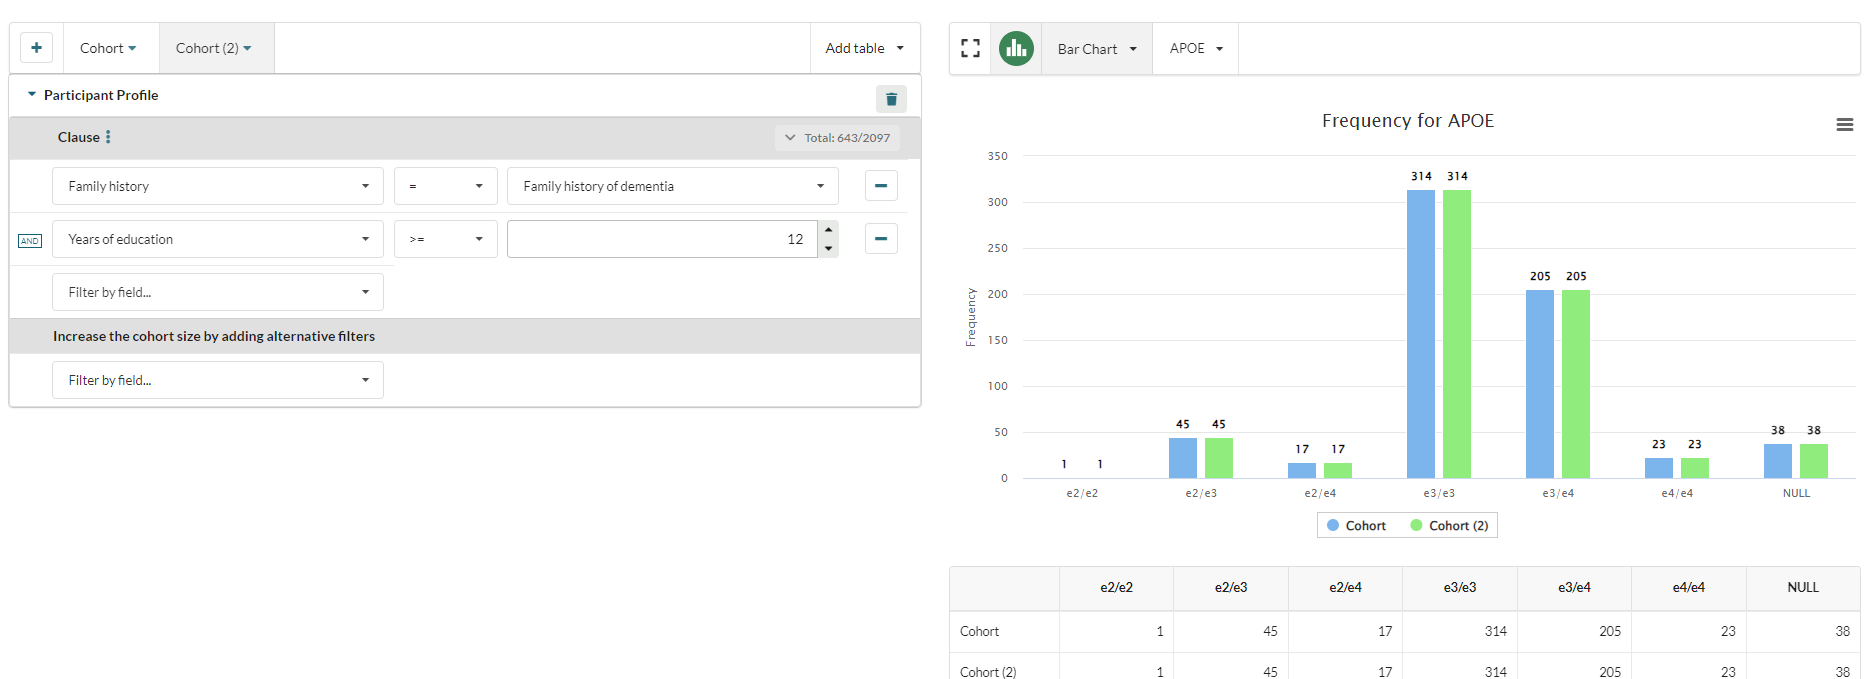
The filters in each cohort can be changed independently, allowing the user to easily visualise the impact on the cohort of any changes to the query.