

Student's T-test
Test a null hypothesis involving the means of two groups by performing a Student's T-test. It is often used in hypothesis testing to determine whether a process or treatment actually has an effect on the population of interest, or whether two groups are different from one another.
Details
The t-test is any statistical hypothesis test in which the test statistic follows a Student's t-distribution under the null hypothesis.
Compute a t-test by selecting a numerical test variable and a categorical grouping variable. The null hypothesis can be configured using the other parameters, for example, you can choose between a one-sided or two-sided test and change the difference in means expected in the null hypothesis.
Output
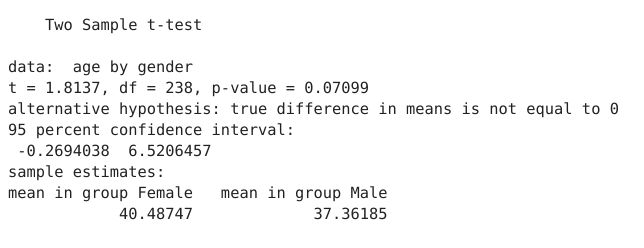
The example below shows how to use the Student's T-test module to test whether there is a significant difference in mean age between study participant groups (males and females).
In this example, our hypotheses are:
- Null hypothesis: true difference in means is equal to 0
- Alternative hypothesis: true difference in means is not equal to 0
The output below shows the results of the t-test. It also includes a plot comparing the densities and means of the selected groups.
The first section of the output is the printed output of a t.test run in R. There are more details on this printed output in the R documentation for t.test.
In the output, we see that the p-value is 0.07, which is greater than 0.05, thus we fail to reject the null hypothesis. We conclude that there there is no significant difference in mean age between males and females.
Parameters
| Variable name | Required | Constraints | Description |
|---|---|---|---|
| test_var | Yes | Column Input. Integer, Decimal | Numerical variable upon which the t.test will be run against. |
| group_var | Yes | Column Input. Text, Integer, Boolean, DateTime, Date | Categorical variable upon which grouping will occur. |
| mu | Yes | Decimal | Value of which to compare the sample mean. |
| alternative | Yes | Text selector. Default to two-sided. | Select from a greater, less or two-sided t-test. |
| paired | Yes | Boolean | Toggle between computing a paired t-test or not. |
| confidence_level | Yes | Decimal. Ranging from 0.5 to 0.99. Default to 0.95. | Set your t-test confidence interval. |