

Mann-Whitney U test
The Mann-Whitney U test (also known as Wilcoxon rank-sum test) is a nonparametric test used to compare whether there is a difference in the dependent variable for two independent groups
Details
The Mann-Whitney U test is the nonparametric equivalent of the two-sample t-test. While the t-test makes an assumption that the population follows the t-distribution, the Mann Whitney U Test makes no such assumption.
The null hypothesis for the test is that there is a 50% probability that a randomly drawn sample from the first population will exceed a sample from the second population, or in other words, that both samples come from the same population.
To perform the Mann-Whitney U test, select a numerical test variable (test_var) and a categorical grouping variable (group_var).
Output
The example below shows how to use the Mann-Whitney U test module to test whether there is a significant difference in mean age between two study participant groups (males and females).
In this example, our hypotheses are:
- Null hypothesis: the age distributions of males and females differ by a location shift of 0
- Alternative hypothesis: the location shift is not equal to 0
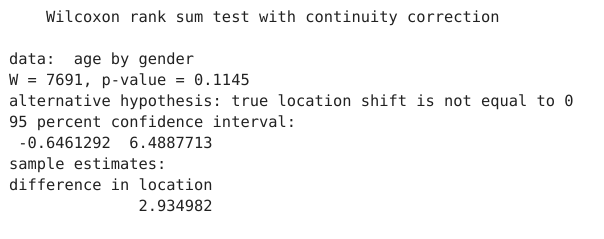
The output below shows the results of the U test. It also includes a boxplot comparing the age distributions of the selected groups (males and females).
The first section of the output is the printed output of a wilcox.test run in R. There are more details on this function in the R documentation for wilcox.test.
In the output, we see that the p-value is 0.11, which is greater than 0.05, thus we fail to reject the null hypothesis. We conclude that there there is no significant difference between females and males mean age.
Parameters
| Variable name | Required | Constraints | Description |
|---|---|---|---|
| test_var | Yes | Column Input. Integer, Decimal | Numerical variable upon which the test will be computed. |
| group_var | Yes | Column Input. Text, Integer, Boolean, Date, DateTime | Categorical variable which provides the two independent samples. |
| mu | Yes | Decimal | The null hypothesis is that the distributions of the samples differ by a location shift of mu |
| alternative | Yes | Text, three options. | Select between a two sided and one-sided test by choosing either two.sided, greater or less. |
| confidence_level | Yes | Decimal between 0.5 and 0.99 | Set your confidence interval, default to 0.95. |