Correlation
Measure the relationship between two numerical variables by calculating the correlation coefficient.
Details
The correlation coefficient (r) ranges from -1.0 to +1.0, which indicates the direction and strength of the relationship between the two variables.
The more extreme the correlation coefficient (the closer to -1 or 1), the more closely the two variables are related. If r is closer to 0, there is little or no relationship between the two variables.
The correlation module offers two correlation methods:
- Pearson correlation is often used for quantitative continuous variables that have a linear relationship
- Spearman correlation is often used to evaluate relationships involving qualitative ordinal variables or quantitative variables if the link is partially linear
Output
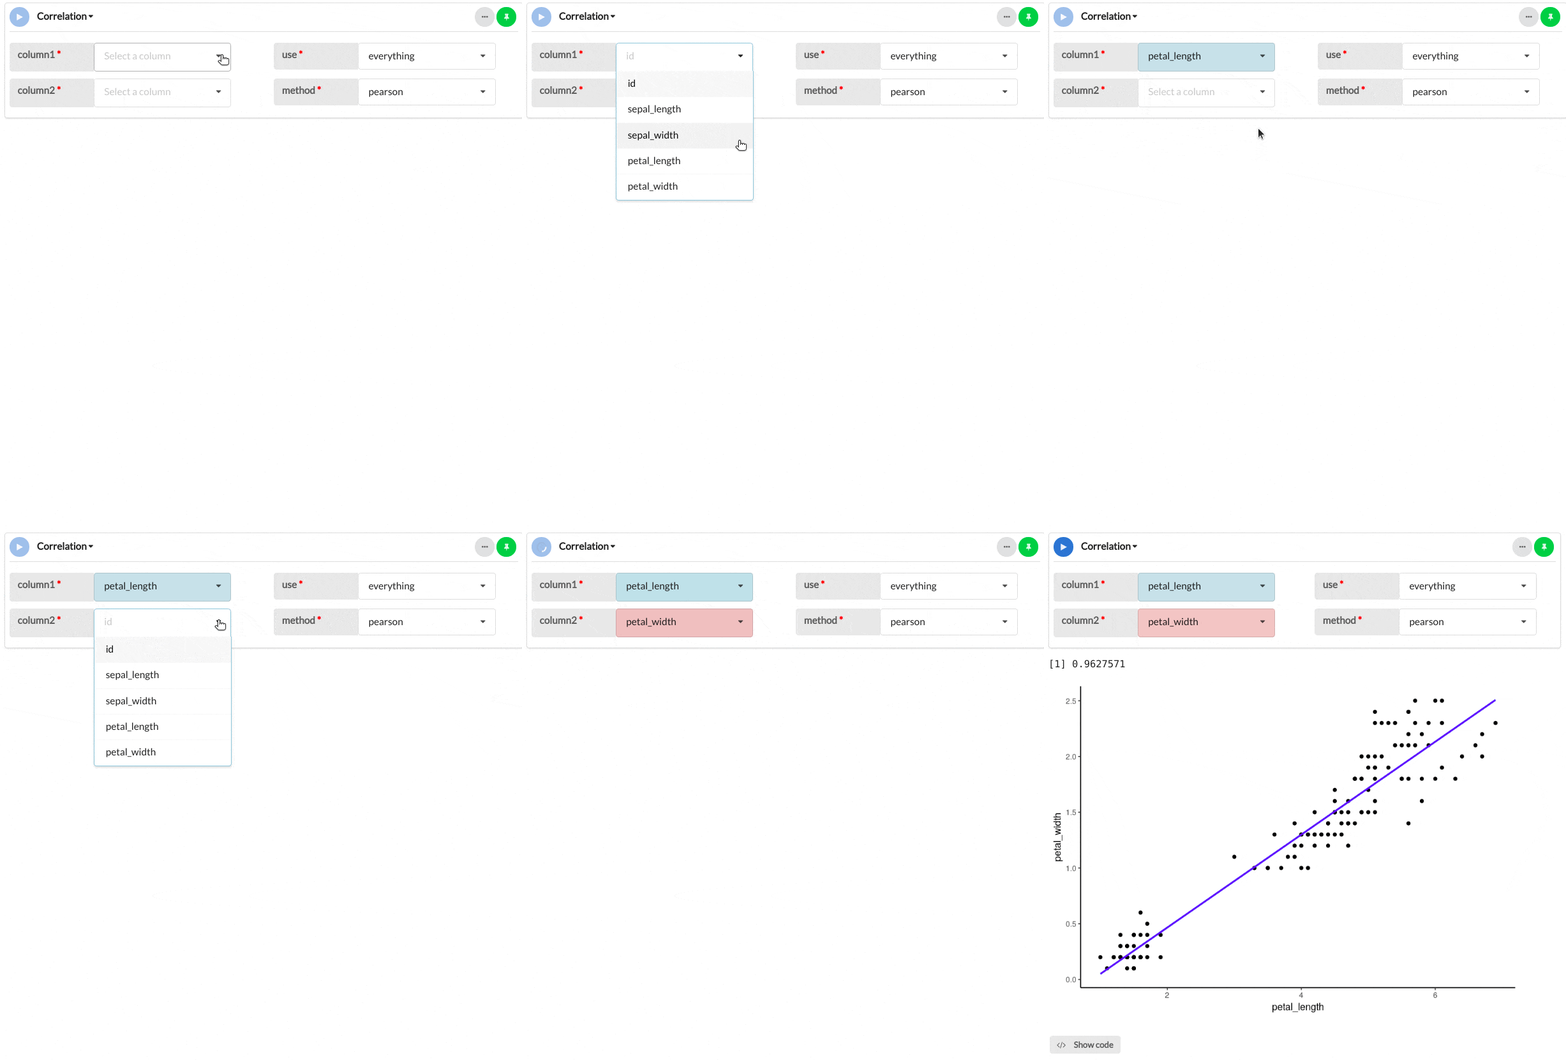
The example below shows how to use the Correlation module to compute the correlation coefficient between petal length and petal width of the Iris flower.
The output shows that the correlation coefficient is equal to 0.96, which is very close to 1, indicating a strong positive correlation between flower petal length and width.
Parameters
| Variable name | Required | Constraints | Description |
|---|---|---|---|
| column1 | Yes | Column Input. Integer, Decimal | Numerical variable upon which the test will be computed. |
| column2 | Yes | Column Input. Integer, Decimal | Numerical variable upon which the test will be computed. |
| use | Yes | Select from five options | How you would like to handle missing data, all.obs assumes no missing data. Select from everything, all.obs, complete.obs, na.or.complete, pairwise.complete.obs. |
| method | Yes | Select from two options | Specify the type of correlation to calculate. Choose between Pearson and Spearman. |
